Results visualization
The simulation results from Nexus-e can be interactively viewed through a visualization tool (also called the “webviewer”), developed with Python Dash.
Repository for the tool: https://gitlab.ethz.ch/nexus-e/nexus-homepage-dash.git
A frontend example: https://nexus-e.org/results-flexibility-providers/
This documentation only introduces the general workflow of developing the visualization tool. Detailed instructions can be found in the README.md files in the associated repositories.
The visualization of the simulation results is achieved in the workflow shown in the figure. The key processes will be explained in the sub-sections below.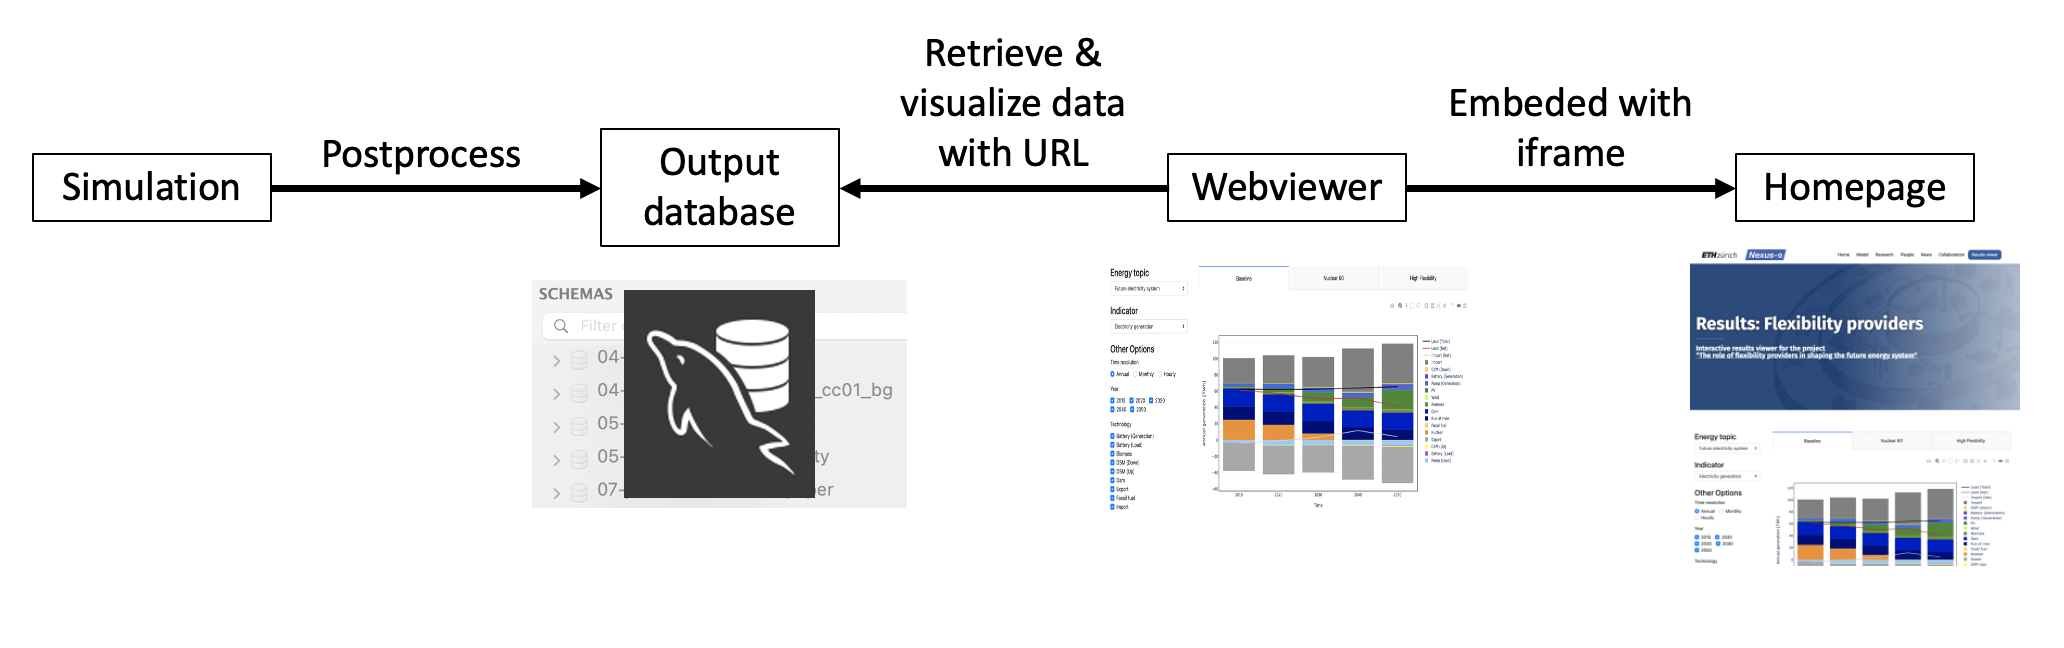
Postprocess
After a simulation finishes, selected results are postprocessed and uploaded to the output database. This postprocess procedure is carried out in the following two ways. The two ways are designed for different purposes and both are needed.
Embedded in the
run_Nexuse.mscriptPurpose: Automatically process the results when finishing a simulation, so that the reseacher could promtly see the results of this simulation from the webviewer.
How it work: After the simulation finishes,
run_Nexuse.mcalls the MATLAB scriptShared/resultPostProcess/postProcess.m. This scripts calls other MATLAB/Python scripts to postprocess the results.
Stand-alone
Purpose: Batch-process multiple simulations, fine-tune/modify/test/debug the post-process scripts.
How it works: Run the MATLAB script
postProcess_batch.mlocally. This script loops through multiple simulations and runs only the required post-process scripts (e.g., we don’t have to run the complete post-process for quick debugging). Which simulations to loop through and which post-processes to run can be configured at the “To be edited” section in the script. Details can be found in the comments in the script.
Note
To properly run the
postProcess_batch.mscript, you need to set up the paths for the required software (e.g., Python, GAMS). To do this, follow the instructions inRun_Nexuse/user_example_conf.mand the online documentation.
Output database
In the output database (host: itet-psl-s04, port: 3307), each simulation’s results is stored in one schema named with the simulation submission date and the scenario name (e.g., the scenShortName variable in run_Nexuse.m), which looks like “01-dec-2020_baseline”.
The output database can be viewed with MySQL Workbench in the same way as introduced here.
Retrieve & visualize data with a URL
After the postprocessed data has been uploaded to the output database, the data can be retrieved and visualized by provideing a URL through the webviewer. Three types of URL are accepted.
https://nexus-e.org/results/JOB-SUBMISSION-DATE_SCENARIO_NAME, e.g., https://nexus-e.org/results/01-dec-2020_baseline. This will retrieve and visualize only the data from the exact MySQL schema named as “JOB-SUBMISSION-DATE_SCENARIO_NAME”.
https://nexus-e.org/results/JOB-SUBMISSION-DATE, e.g. https://nexus-e.org/results/01-dec-2020. This will retrieve and visualize the data from all the MySQL schemas whose name start with “JOB-SUBMISSION-DATE”. In other words, results from all simulations submitted on the same day will be shown on the website.
https://nexus-e.org/results/MANUALLY_DEFINED_URL, e.g. https://nexus-e.org/results/project. This will retrieve and visualize the results from all simulations associated with the MANUALLY_DEFINED_URL. This is particularly useful if we run multiple scenarios for one project. The mapping of URL and simulations is specified in the
constants.pyin the repository for the webviewer.
Note
Synchronizing data between the web server and the database
Not all changes in the output database will be automatically sychronized to the webviewer. The reason lies in how the data is downloaded from the database to the web server: based on the given URL, the webviewer checks the output database and decides which simulation(s) will be shown, i.e., which schema(s) should be downloaded to the web server; the webviewer then checks (by comparing the existing folder names and the schema name) whether the needed schema has already been downloaded; if the viewer finds a folder with the same name as the needed schema, it won’t re-download the schema.
Therefore, to show a changed data in the output database (e.g., after changing the postprocess script, added new data), you need to first delete the corresponding data folder on the web server so that the webviewer will re-download the data from the database.
Embed the webviewer into the homepage
The webviewer itself is plainly a Python Dash application without much Nexus-e branding. To change this, it is embedded into the homepage with iframe - a html element to display a nested webpage within another webpage. By doing so, we can easily have the same header, footer and menubar for the visualization tool as in other Nexus-e webpages.
The embedding can only be done by the administrators of the homepage. If you are an administrator, you could login to the homepage and check the backend of this page to learn how it is done.